Member-only story
Julia Plotting Cheat Sheet
4 min readApr 16, 2023
This cheat sheet provides an overview of the most commonly used plotting functions and attributes in Julia using the popular plotting library Plots.jl. To get started, make sure you have the Plots package installed by running:
using Pkg
Pkg.add("Plots")
Then load the Plots library by running:
using PlotsBasic Plotting Functions
Line plot:
function linePlot()
    x = 1:0.1:10
    y = cos.(x)
    plot(x, y, label="cos(x)")
end
function scatterPlot()
    x = 1:0.1:10
    y = cos.(x)
    scatter(x, y, label="cos(x)")
end
function barPlot()
    x = 1:0.1:10
    y = cos.(x)
    bar(x, y, label="cos(x)")
end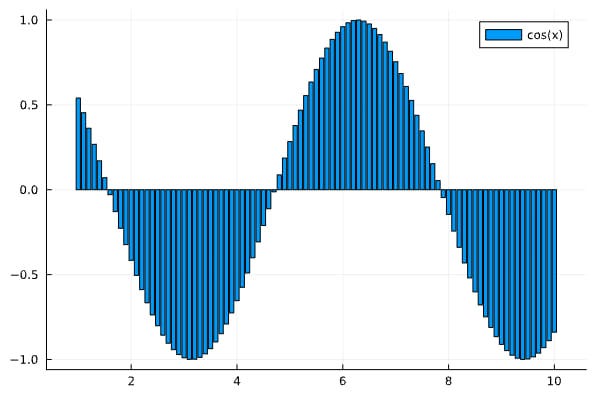
Histogram:
function histogramPlot()
    x = 1:0.1:10
    y = cos.(x)
    histogram(x, y, label="cos(x)")
end
2Box plot:
using StatsPlots
function boxPlot()
    x = 1:0.1:10
    y = cos.(x)
    boxplot(x, y, label="cos(x)")
end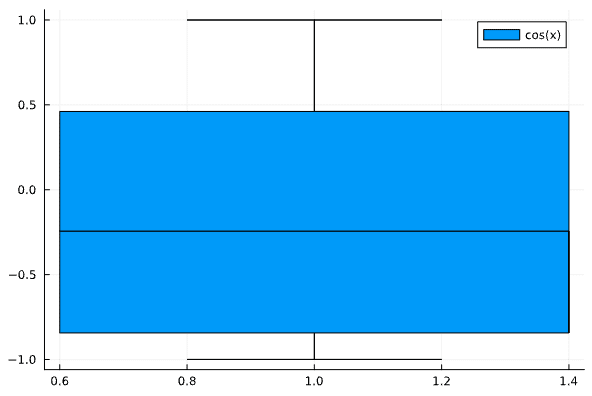
function heatmapPlot()
    data = rand(21, 100)
    heatmap(1:size(data, 1),
        1:size(data, 2), data,
        c=cgrad([:blue, :white, :red, :yellow]),
    )
end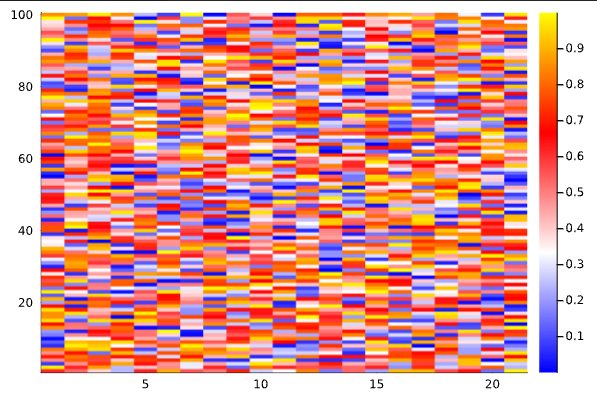
3D plot:
function plot3D()
    x = 1:0.1:10
    y = cos.(x)
    z = sin.(x)…